
Data analaysis Part 11: Covariance, its application and limitations
Covariance, its application and limitations

- Variance is a parameter in statistics that measures variation of a single random variable.
In comparison, covariance (co-variance) measures how two independent random variables vary together.
Covariance measures directional relationship between two independent random variables.
Examples:
Sale of ice cream with temperature of a place
Effect of USA stock market on Indian stock market
Effect of no. of working hours on production of a company
Effect of hours of study on marks obtained in an examination
All the above factors or 1st random variables (temperature of a place, USA stock market, no. of working hours and hours of study) may have either positive effect or negative effect or no effect on the results or 2nd random variable (Sale of ice cream, Indian stock market, production of a company, marks obtained in an examination).
Formula
Sample covariance

Population covariance
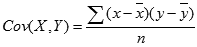
x̄ = sample means of variable x
Covariance can be of three types
Cov(Variable 1, Variable 2) > 0 : Covariance = +, Both variables move in same direction.
Cov(Variable 1, Variable 2) < 0 : Covariance = -, Both variables move in opposite direction.
Cov(Variable 1, Variable 2) = zero : Covariance = 0, Both variables are not related to each other.
Example 1: Effect of temperature on ice cream sale
Table.1
| Temperature (oC) | Ice cream sale/ day |
|---|---|
| 35 | 520 |
| 37 | 600 |
| 45 | 760 |
| 49 | 850 |
| 43 | 650 |
| 39 | 610 |
| 46 | 830 |
Value of Sample Covariance = 621.7
Value of Population Covariance = 532.9
Fig.1

As it can be seen from above Table.1 and Fig.1 that, sales of ice cream and temperature of a place is related to each other.
Example 2: Effect of USA stock market on Indian stock market
Table.2
| Year | Dow Jones | Sensex |
|---|---|---|
| 2011 | 2.74 | -15.67 |
| 2012 | 3.73 | 12.99 |
| 2013 | 19.6 | 6.41 |
| 2014 | 13.53 | 34.05 |
| 2015 | 1.52 | -10.5 |
| 2016 | 20.02 | 7.06 |
| 2017 | 24.44 | 23.14 |
| 2018 | -10.79 | 0.29 |
| 2019 | 14.16 | 13.78 |
| 2020 | 6.7 | 12.14 |
Value of Sample Covariance = 84.0
Value of Population Covariance = 75.6
Fig.2

As it can be seen from above Table.2 and Fig.2 that, US Dow jones and Indian sensex are related to each other.
Limitations
Covariance measures the direction of a relationship between two independent variables but does not measure the strength of the relationship.
Another statistical parameter correlation measures the same. It will be discussed in subsequent articles.
Reference
All references are hyperlinked in the text.


Comments
Post a Comment