Labels (Click here)

COVID196 Statistics6 Bhagavad Gita5 Chernobyl accident5 Other than Science5 RBMK reactor5 Reactor Physics5 Srimad Bhagavad Gita5 Chapter wise Summary of Bhagavad Gita4 Clinical trial4 Gist of Bhagavad Gita4 Summary of Bhagavad Gita4 Covaxin3 Education Qualification3 features of Chernobyl reactor3 logo3 Ayodhya Ram Temple2 Cancer2 ChAdOx1 nCoV-192 Covariance2 Covishield2 Delayed Neutron2 Difference between2 Education of CEOs2 Evergreen Quotes2 ISRO2 Indian Festivals2 Indian nuclear power2 NPS2 Nuclear Medicine2 Nuclear reactors in India2 Quotes2 Radioactivity2 Ram temple2 Science and Technology2 Shri Ram Janmbhoomi2 Shri Ram Janmbhoomi Teerth Kshetra Trust2 Spiritual2 Surgery2 Unknown facts2 t test2 'Carpet' Karlsruhe Nuclide Chart1 18 Chapters 18 Slokas of Bhagavad Gita1 225Ac1 225Ac-HEHA1 5th September1 700MW PHWR1 ACS1 ANOVA test1 Academic Degree1 Airports1 Analytical Applications1 Analytical techniques1 Animal trial1 Anniversary1 Applications of Radioactivity1 Astonishing facts1 BBV1521 Bachelor degree1 Bateman Equation Methodfor Half Life Determination1 Beta delayed Neutron1 Bhagavad Gita Gist1 Birth places of Indian Presidents1 Blog1 Blue hydrogen1 Brown hydrogen1 CM1 COP281 Cancer - WHO1 Cancer death rate1 Cancer in India1 Central Vista1 Chandrakant Sompura1 Chandrayaan-31 Chandrayaan-3 mission1 Chapter 1 of Bhagavad Gita1 Chapter 3 of Bhagavad Gita1 Chemotherapy1 Climate change1 Criticality1 DSAM1 Detection Limit1 Distributions1 Doppler Shift Attenuation Method1 Doppler effect1 Dr Sarvepalli Radhakrishnan1 Dubai1 EVM1 Educational Qualification of Indian PM1 Educational Qualification of Indian Presidents1 Educational qualifications ofB R Ambedkar1 Electronic Voting Machine1 Elsevier1 Elsevier logo1 F test1 Financial1 First blogging Anniversary1 GEO SAT1 Google1 Google Meet1 Green hydrogen1 Grey hydrogen1 Guru Purnima1 Half Life Determination1 Half life 10^-9-10^-12 years1 Half life 10^22 years1 How1 Hydrogen energy1 Hyperthermia1 IAEA1 IIT-JEE-NEET-ebooks1 INSAT1 INSAT-3D1 INSAT-3DR1 India's historical inflation1 India's inflation1 India's moon mission1 Indian PM1 Indian festival1 Industrial Applications1 Industry1 Inflation India1 Intensive prefix1 Internet1 Jamai Sasthi1 KAPP1 Kakrapar Atomic Power Project (KAPP)1 LEO SAT1 Long lived radioisotopes1 Low Earth Orbit1 MEO SAT1 Magazine1 Makar Sakranti1 Management1 Medical Applications1 Medicine1 MixedCOVIDVaccine1 NPCIL1 Narendra Modi1 Neutron1 Neutron emission1 New Parliament Building1 Newspaper1 OnlineTeaching1 Oxoford Astrazeneca1 Peer Review1 Population and sample standard deviation1 Preclinical trial1 Quality control1 RDM1 Radiation1 Radiation Applications1 Radiation Applications.1 Radiation dose units1 Radioactive decay1 Radiochemical1 Radiopharmaceutical1 Re-search1 Reactor1 Recoil Distance Plunger Method1 Reference Source Method for Half Life Determination1 Research1 SMR1 Satellite based Internet1 Sensitivity1 Small modular reactors1 Space1 Speciality1 Specific Activity Method for half life measurement1 Springer1 Springer logo1 Targeted alpha therapy1 Teacher's Day1 Teachers' day1 Teachers' day in India1 Teachers' day in world1 Tenure1 Theoretical Computational method for Half Life Determination1 Top Search result1 VaccineSideEffect1 Voting in India1 Wacom Writing Pad1 Weather satellite India1 What1 White hydrogen1 Worldwide Cancer rate1 Zoom1 ZyCov-D1 determination of ultra short half life1 festival1 indigenous nuclear reactor1 life1 life lines1 mean and median1 pfizer1 scientificdiary.net1 srjbtkshetra.org1 t1/2 ~100 years1
Show more

Data analysis Part 4: Standard deviation and Standard error

Data analysis Part 4: Standard deviation and Standard error

1. Standard deviation (`\sigma`)

The standard deviation is used to describe the dispersion or variability or spread of the data in 'sample' or in the 'population'. 

Standard deviation = Dispersion or Variability or Spread of the data.

  • Application

Used to measure the precision or spread of the data.  

2. Standard error (`\sigma_\overline{x}`)

 Error is about difference of obtained value to true value. 

Error = value obtained from a 'sample' - the 'true' value for the 'population'.

Lesser the error, higher the chances that the obtained value of the 'sample' represents the 'population' better.

  • Standard error for 'single set' of measurement 

Sample mean `\ne` population mean.

For single set of data from population, where single set of data contains N measurements, sample mean and sample standard deviation can be calculated. If we divide sample standard deviation by `\sqrt N`, it will be called standard error.

As per Sylvia Wassertheil-Smoller, Sample mean deviates from population mean. This deviation is called Standard error or Standard error of mean for a single set of measurements[1].

Standard error = |Sample mean - population mean|.

As per Curran-Everett et al, Standard errors characterize uncertainty about the estimated values of population parameters, e.g., means. [2]

The standard error is used to draw inferences about the
population mean from which we have sample. 

`\sigma_\overline{x}=\frac\sigma{\sqrt N}` 

N = No. measurements

Standard error for 'single set' decreases with increase in N. With infinite no. of N, the difference between sample and population becomes so less that, both shall become same. Lets take an example...

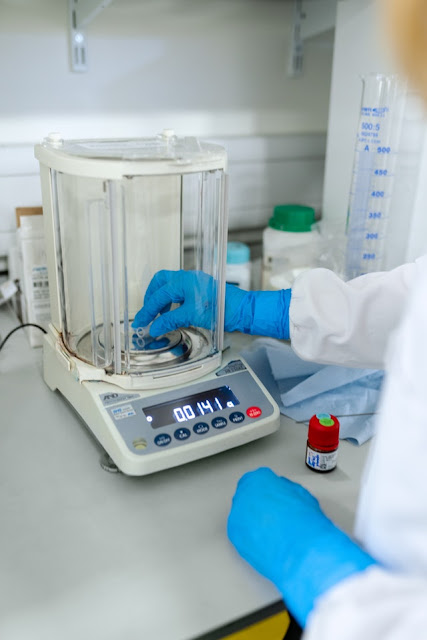
Paracetamol tablets (500mg) were collected from market. With semi micro balance, wt. of 5 paracetamol tablets were taken. 

Let's say the wt. (mg) of the 5 tablets are

Set 1
499.643
499.475
500.459
499.692
497.946

N = 5

Sample mean: 499.443

Standard deviation (`\sigma`): 0.919

Standard error `\sigma_\overline{x}`: 0.411. 

So the difference between sample mean and population mean is 0.411. 

If we increase the no. of sample (N) in a single set the the plot of SD and SE vs N shall be as following (Fig.1):  

Fig.1: SD and SE vs N 

So for more and more samples, the standard error (SE) decreases and for infinite no. of samples, the SE shall be almost negligible. For infinite no. of samples, Sample mean shall be population mean.

Details of the sample i.e. wt. of the paracetamol 30,000 tablets can be found here.

  • Standard error for 'multiple set' of measurement 

Standard error = Standard deviation of the sample means.
As per Douglas A. Skoog, For multiple sets of data from population, where each set of data contains N measurements, if we calculate the mean of each set of data it will show a certain spread. The standard deviation of these means are called standard error[3]. 

Mean of each set shall show less scatter with increase in N.  Hence standard error for 'multiple set' decreases with increase in N.

Set 1 Set 2 Set 3 Set 4 Set 5 Set 6
499.642 500.280 499.251 498.547 500.828 500.240
499.475
500.072 500.808 501.282 501.772 501.055
500.459
500.054 500.224 499.672 499.615 500.120
499.692
499.619 500.083 499.086 500.491 500.680
497.946
500.761 500.747 499.600 499.105 500.478

Mean

Set 1 Set 2 Set 3 Set 4 Set 5 Set 6
499.443 500.157 500.222 499.637 500.362 500.514

Mean of the means (Set 1-6): 500.056   

Standard deviation of the means (Set 1-6): 0.422  

Standard error (SE) (`\sigma_\overline{x}`) = 0.422 

  • Application

Standard error is useful primarily because of its role in the calculation of a confidence interval.

  • When to use Standard deviation? When to use Standard Error?

Its dependence on sample size makes the standard error of the
mean an inappropriate estimate of variability among observations. Hence for reporting data, where intention is to highlight the spread of the data, standard deviation should be used not standard error. For calculating confidence interval, standard error is used. 

Reporting spread of data `\rightarrow`  Standard deviation ✔, Standard error

Reporting Confidence interval `\rightarrow` Standard error ✔, Standard deviation

Reference

[1] Biostatistics and Epidemiology, A Primer for Health and Biomedical Professionals, By Sylvia Wassertheil-Smoller, Jordan Smoller, 4th Ed, 2015, p41.

[2] Curran-Everett, Douglas, Sue Taylor, and Karen Kafadar. "Fundamental concepts in statistics: elucidation and illustration." Journal of Applied Physiology 85.3 (1998): 775-786

[3] Fundamentals of Analytical Chemistry, Douglas A. Skoog, Donald M. West, F. James Holler, Stanley R. Crouch, ISBN-13: 9780357450390, ISBN-10: 0357450396, Publisher: Cengage, 10th Edition, 2021, p62.

Comments

Popular post

Educational qualification of Indian Prime ministers

(Updated Mar 2024) Educational qualification of Chief Ministers of Indian states and Union territories

10 Unknown facts about Srimad Bhagavad Gita- Part 1

Bhagavad Gita Gist: 18 important slokas (verses) from 18 chapters

Educational qualifications of Indian Presidents

Why Bachelor's degree is called Bachelor's degree?

Why the recommended time gap between two covishield vaccine doses is 90 days and above?

About the Author

Please Like, Share and Comment your experience.

Subscribe through Contact Us

Know us through About Us

Popular posts from this blog

Educational qualification of Indian Prime ministers

(Updated Mar 2024) Educational qualification of Chief Ministers of Indian states and Union territories

Bhagavad Gita Gist: 18 important slokas (verses) from 18 chapters

10 Unknown facts about Srimad Bhagavad Gita- Part 1

India's historical inflation data during the tenure of various Indian Prime Ministers

Educational qualification of Dr.Bhimrao Ramji Ambedkar or Baba Saheb Ambedkar or B R Ambedkar

Educational qualification of top 10 CEOs of Indian companies